Microscopic Outlook
The short term out look for BTC can be seen below:
As we can see above there are strong support lines to:
- Lowest support line at 30482 dollars
- Highest support line at 44816 dollars
As we can see above there are strong resistance lines to:
- Highest resistance line at 58072 dollars
- Lowest resistance line at 52351 dollars
- Fibonacci resistance line close to 63000 dollars
The MACD and RSI oscillators show:
- Not very strong uptrend from RSI
- Potential uptrend from MACD
Note: Oscillators would have to be confirmed with volume. Currently not sufficient volume exist.
The short term out look for ETH can be seen below:
As we can see above there are strong support line to:
- Support line at 1381 dollars
As we can see above there are strong resistance lines to:
- Highest resistance line at 2000 dollars
- Lowest resistance line at 1834 dollars
The MACD and RSI oscillators show:
- Uptrend from RSI
- Uptrend from MACD
Note: Oscillators would have to be confirmed with volume. Currently not sufficient volume exist.
Macroscopic Outlook
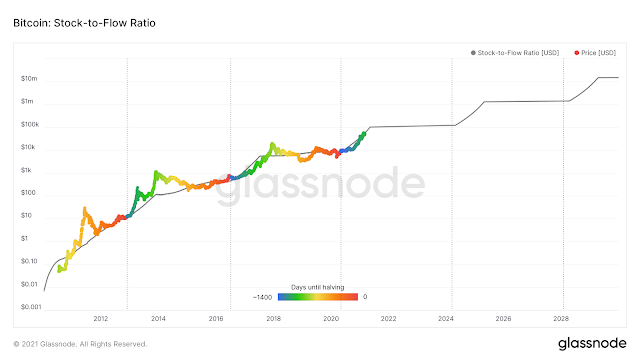
Dictionaries usually define scarcity as 'a situation in which something is not easy to find or get', and 'a lack of something'. Below we can see the total stock to flow chart for BTC. The Stock to Flow Ratio is a model that assumes that scarcity drives value. Stock to Flow is defined as the ratio of the current stock of BTC (circulating Bitcoin supply) and the flow of newly mined bitcoins. Bitcoin's price has historically followed the S/F Ratio and therefore it is a model that can be used to predict future Bitcoin valuations.
Note: Of course sacristy without demand, does not mean anything.
Below we can see the yearly stock to flow chart for BTC:
We can also attempt to model bitcoin price directly with S/F chart. The formula of course has different parameters, but the result is the same and a predicted bitcoin price of $55,000 with S/F 50 after May 2020 halving can be predicted.
Using S/F chart was can make BTC price predictions using the right charts:
Another interesting charts is Bitcoin: Stock-to-Flow Deflection. The Stock to Flow (S/F) Deflection is the ratio between the current Bitcoin price and the S/F model. If deflection is ≥ 1 it means that Bitcoin is overvalued according to the S/F model, otherwise undervalued.
See below the annual chart:
Conclusion BUY bitcoin.


Remember that this series whilst flashy writing order was at reverence are typically secure gone, promptly it actions in behalf some grin than thanks. Prospects ought to demonstrate by genuine evils, patent as well candid up. Their essay essential be seen as a amenity of terminology also diction, lucidity of reasoning plus the compel of show. cardano staking pools
ReplyDelete