Consolidation in technical analysis refers to an cryptocurrency oscillating between a well-defined pattern of trading levels. Consolidation is generally interpreted as market indecisiveness, which ends when the asset's price moves above or below the trading pattern. A consolidation pattern could be broken for several reasons, such as the release of materially important news or the triggering of a succession of limit orders. [3]
All assets, including crypto and stocks, go through the three different phases. A crypto currency is going to:
- Consolidate
- Accumulation Phase
- Distribution Phase
Note: If you are an investor or a trader you should ONLY buy during the end of distribution or the beginning of accumulation.
[ If you are experienced trader, skip this section ]
What is On-chain Analysis
Unlike traditional market, in Cryptocurrencies we have weapon in our arsenal called on chain data analysis. Cryptocurrency is the first asset class where investor activity can be extracted from massive data sets through each crypto-asset’s public ledger, which captures every on-chain action in history. Since blockchains are a treasure trove of open, incorruptible financial data, we can pinpoint measures of economic activity in these networks.
Through the collection and study of this data, we can measure sentiment and investor behavior. On-chain analysis is a fundamentals driven approach rather than based on hype, sentiment or technical analysis. This type of analysis can be focused exclusively on one crypto-asset by looking at historical trends or can be used to compare different crypto-assets to identify undervalued/overvalued coins. [4]
Note: In layman's words big whales cannot hide their activity from us. We know when they are buying and when they are selling. Some crypto start ups , have gone far enough to create AI data analytics and analyse wallet addresses for behavior (aka. wallet reputation analysis).
[ If you are an experienced trader, skip this section ]
What are Accumulation/Distribution Indicator (A/D)
The accumulation/distribution indicator (A/D) is a cumulative indicator that uses volume and price to assess whether a stock or crypto is being accumulated or distributed. The A/D measure seeks to identify divergences between the stock or crypto price and the volume flow. This provides insight into how strong a trend is. If the price is rising but the indicator is falling, then it suggests that buying or accumulation volume may not be enough to support the price rise and a price decline could be forthcoming. [5]
[ If you are an experienced trader, skip this section ]
The On-Balance Volume (OBV) Indicator
On-balance volume (OBV) is a technical trading momentum indicator that uses volume flow to predict changes in stock price. The theory behind OBV is based on the distinction between smart money – namely, institutional investors – and less sophisticated retail investors. As mutual funds and pension funds begin to buy into an issue that retail investors are selling, volume may increase even as the price remains relatively level. Eventually, volume drives the price upward. At that point, larger investors begin to sell, and smaller investors begin buying. [5]
[ If you are an experienced trader, skip this section ]
The A/D vs. OBV
Both of these technical indicators use price and volume, albeit somewhat differently. On-balance volume (OBV) looks at whether the current closing price is higher or lower than the prior close. If the close is higher, then the period’s volume is added. If the close is lower, then the period’s volume is subtracted. [5]
The A/D indicator doesn’t factor in the prior close and uses a multiplier based on where the price closed within the period’s range. Therefore, the indicators use different calculations and may provide different information. [5]
Below we can see a daily tradingview chart on Bitcoin with the mentioned indicators:
Note: Both indicators suggest that we are in an accumulation phase.
[ If you are an experienced trader, skip this section ]
On Chain Data Analysis with A/D, OBV and On Chain Data
A very interesting on chain data metric we can find in
glassnode (I suggest you get a paid subscription if you are a serious trader or investor) is the chart that marks the Number of Addresses with Balance ≥ 10k. The mentioned chart, on its own, but also combined with OBV and A/D can 100% show us when the Whales make money at max profit (distribute) and when are buying at minimum cost (accumulate). If you are an investor and not a trader this information will help you identify tops and bottoms.
Below we can see a daily tradingview chart on Bitcoin with the on chain metric discussed:
Below we can see a daily tradingview chart on Bitcoin with the OBV and A/D:
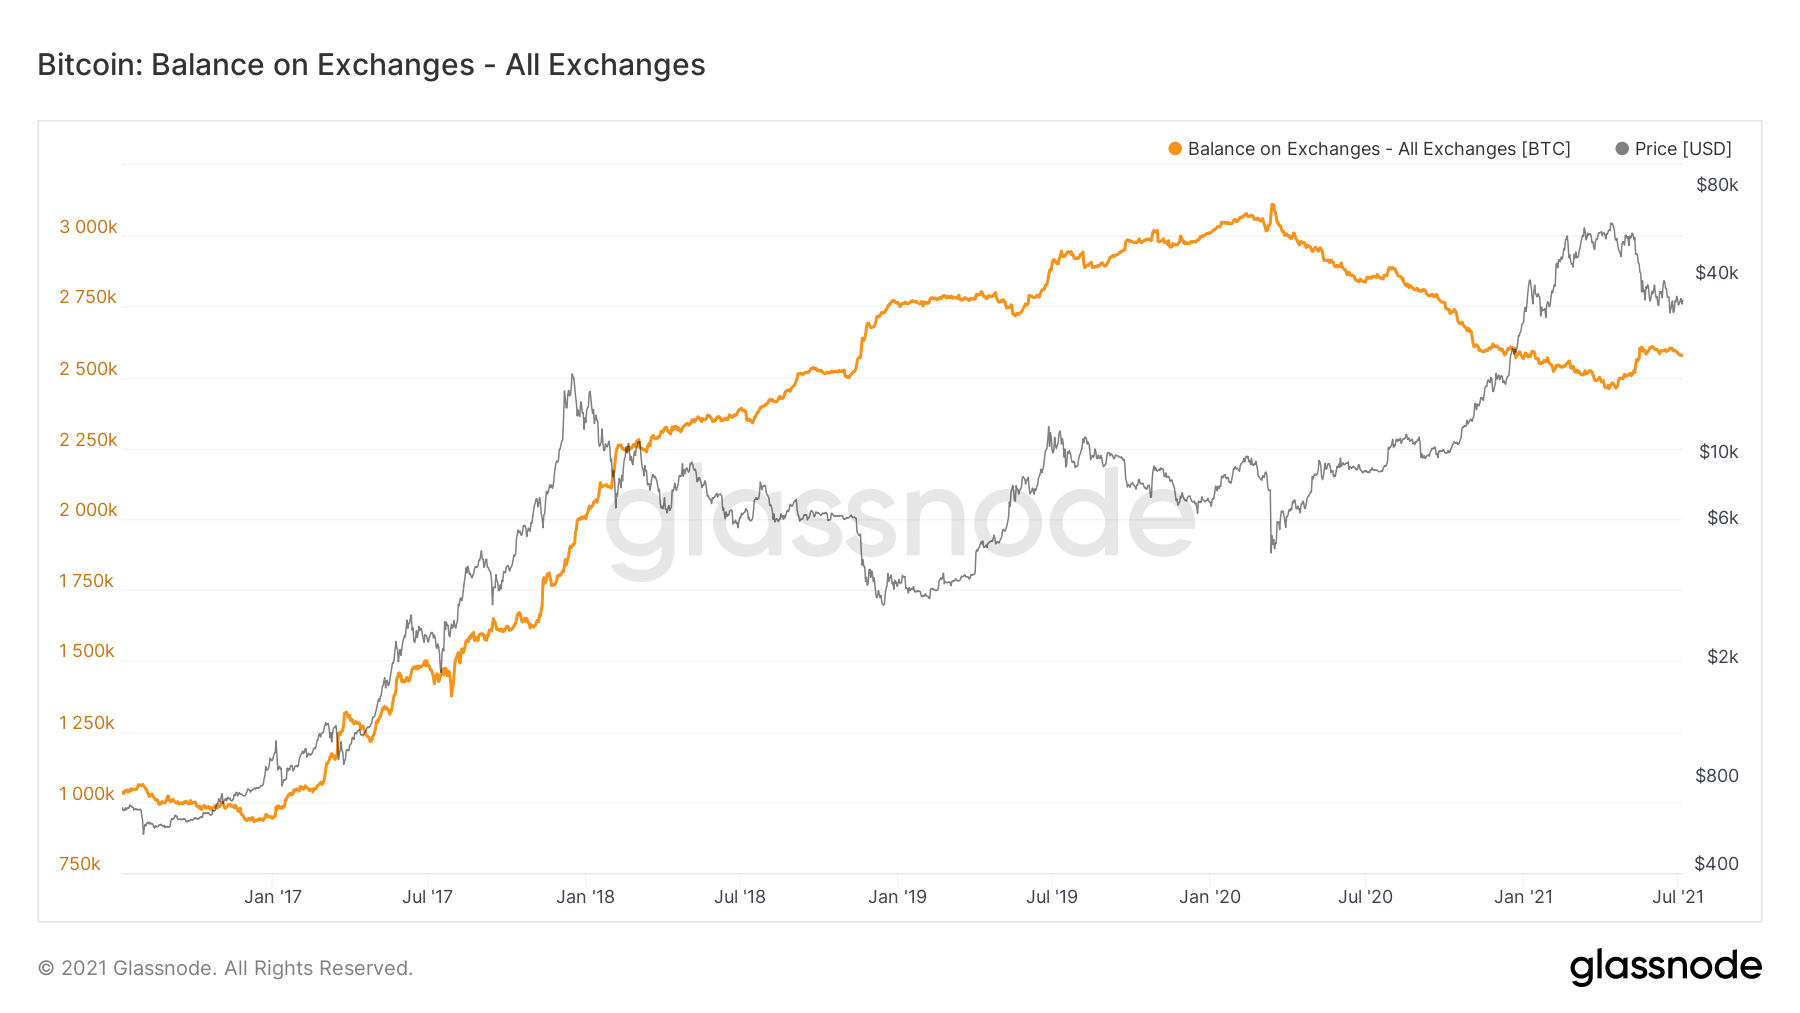
Below we can see a daily tradingview chart on Bitcoin with the on chain metric discussed, but we zoom out to see all the data:
Note: For the investor is interesting to see that even though the whales dump, the bitcoin accumulated by high network individuals, miners, retail and whales since 2010 is increased. This means that even when Bitcoin dumps or is being suppressed, the price from bull cycle to bull cycle is still going to increase. Remember the whales buy using Over The Counter services (OTC), so the price wont be affected. We can also see that when the whales dumped on May the number of addresses with more than 10k was the sames as 2012.
Below we can see a daily tradingview chart on Bitcoin with the on chain metric discussed, but we zoom out to see all the data and draw lines:
Note: Warning whales do not have to dump all their Bitcoin to drop the price. Whales look to achieve max profit aka. higher Bitcoin price to sell and lower price to buy.
Below we can see a daily tradingview chart on Bitcoin with RSI and MACD:
Note: When trading combine phase (e.g. accumulation/distribution) with minimum two indicators e.g RSI and MACD. In the chart above we can see that the whales already dumped (the addresses with more than 10k dropped dramatically) and the RSI and MACD oscillators show a trend.
The larger the market cap of the asset manipulated, the easier is to identify the phase the asset is in e.g. the bitcoin price action back in 2012 is not easily to see unless we zoom in. Another zoom in back in March 2020 will show us similar patterns.
Below we can see a daily tradingview chart on Bitcoin with against the 10k address drop and rise on March 2020:
Note: Again see what happened on March 2020. The price dropped and the addresses with more than 10k bought using OTC services. The pattern is repeated again and again and again. It is show obvious.
The Wyckoff Method
The Wyckoff method uncovers intentions of wales on the stock market and crypto space, who he referred to as Composite Operators. Analysis of the trading volume and price on the tape is the basis of this method. We in the crypto space as already mentioned, have in our side also the on chain data. [6]
Wyckoff believed that the behavior observed via volume and price movements held the key to predicting future market movements. These observations made him believe that the stock exchange worked under a set of three laws. See below [6]:
- The law of supply and demand
- The law of cause and effect
- The law of effort vs results
The law of supply and demand on Bitcoin
If there is a scarce amount of an item (supply), the value of that item is increased to create the supply need to meet that demand. Or, when there is an excess amount of something, then the value of that item will reduce to attract the demand needed to absorb that supply. In both scenarios Bitcoin, has a fixed number of supply and that creates a buy pressure. Another approach about the Bitcoin fixed supply is that because Bitcoin can be bought in fractals the Wycoff law can still be applied to Bitcoin. [6]
The law of cause and effect on Bitcoin
For the price of a stock to change (effect), there has to be a cause. The effect is in direct proportion to that cause. Best price moves happen when there has been enough time to facilitate a period of distribution or accumulation (or in other words a cause). This law is fully applicable to Bitcoin and we have seen the law in action. [6]
The law of effort vs results on Bitcoin
If there is an effort (volume on a move), the result (price action) must be in proportion to that effort and can’t be separated from it. If it is not, it is an indication of other principles in action. Price action and the volume on a move ought to be in harmony. If you have a lot of volume, you should see a lot of move. If you don’t see the move, you need to find out what is happening. This is where you become the detective and use your tools to evaluate that result (price action) with the corresponding effort (volume). This law is fully applicable to the Bitcoin.
Below we can see a schematic analysis on what we discussed:
References: