
Introduction
This blog post is going to focus on facts and charts as usual and will describe the current situation. Are we in a bull market? Are we in a bear market? What is going on? The answer is simple for the long run the entry point for Bitcoin and Ethereum does not real matter.
It is a fact now, that the lesser the use cases of an established crypto currency such as Bitcoin the better. Bitcoin is an asset that has minimal use cases (e.g. Storage of Value , transportation properties etc.) , excellent network effect and it is being adopted by institutions and backed by math and cryptography. Should you be concerned by the drop prices? Not if you are an investor. Now if you trade Bitcoin , then yes, you have to be aware of the current situation and the FUD generated by the media.
The Macro outlook (On Chain Data and Fundamentals)
In this section we will check the macros and for once more see where we are seating. The most important facts to focus on are demand and scarcity. Scarcity can easily be seen from the glassnode charts below.
Below we can see the two week balance on exchanges:

Note: As we can see Bitcoin scarcity is on the rise for the last two weeks.
Below we can see the five year balance on exchanges:
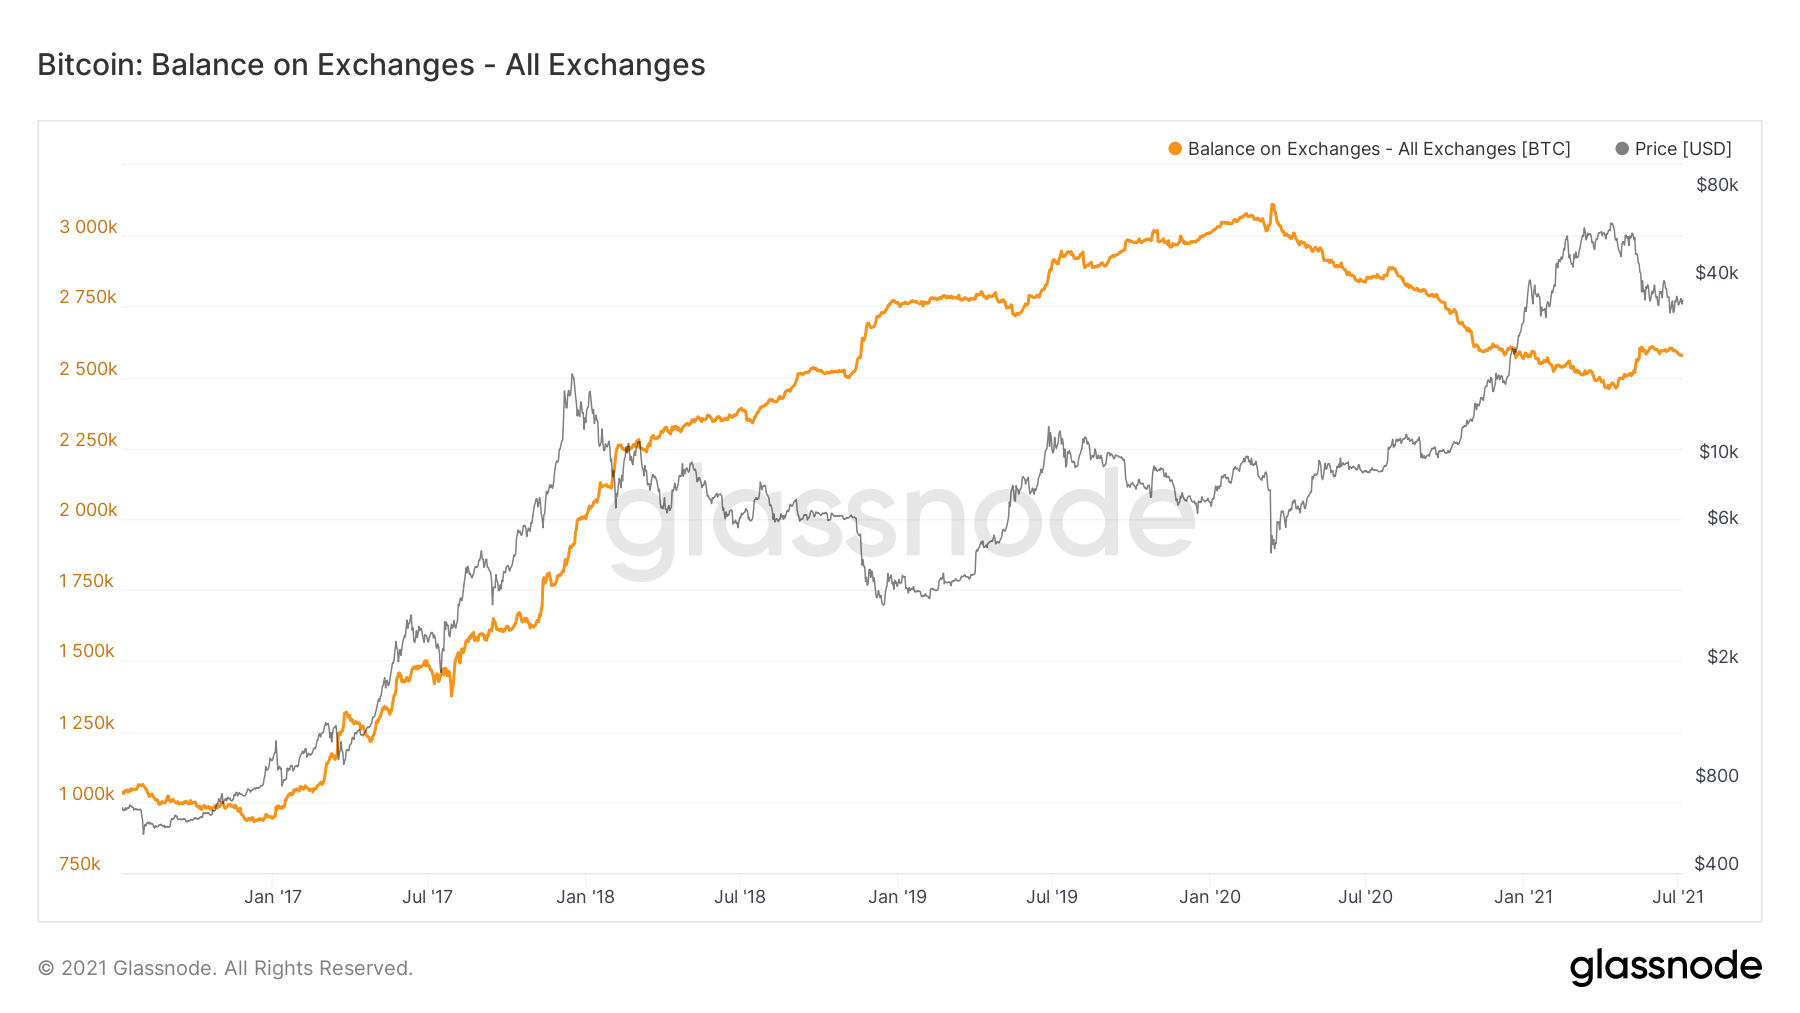
Note: As we can see Bitcoin exchange balances , picked and then started to decline after 15th of March 2020. And since then it is still dropping.
Another interesting chart we can see (from again from on chain data analysis) is the NUPL chart. From the chart below we can see that the NUPL chart was reset for good. This is for me a strong sign of temporary Bull disruption, rather than a pure long Bear market.
Below we can see the five year NUPL chart for Bitcoin:

the market cap as described in this article.
Below we can see the two week NUPL chart for Bitcoin:

Note: As we can see Bitcoin NUPL chart, again is reset.
Below we can see the five year aSOPR chart for Bitcoin:

Note: As we can see Bitcoin aSOPR chart is again reset for good. Adjusted SOPR (aSOPR) is SOPR ignoring all outputs with a lifespan of less than 1 hour. The Spent Output Profit Ratio (SOPR) is computed by dividing the realized value (in USD) divided by the value at creation (USD) of a spent output. Or simply: price sold / price paid. This metric was created by Renato Shirakashi. SOPR and aSOPR is used to demonstrated local (monthly) and global (annual) bottoms and tops.
Below we can see the two week aSOPR chart for Bitcoin:

Note: As we can see Bitcoin that the two week aSOPR chart shows a reset. This is a good indicator we hit a global bottom.
We covered the scarcity, facts , now lets cover the demand facts. Is there a demand for bitcoin??? Hell yea man. Bitcoin is being accumulated and there is a great demand about it. We can see that from the fundamentals aka. the news released about Bitcoin.
Below we can see certain news about the demand being increased:
- Adaptation from El Salvador
- Adaptation from Paraguay (expressed interest)
- Adaptation from Panama (expressed interest)
Note: For more information see thestreet.com
The Micro outlook (On Chain Data and Charts)
Below we are again going to focus on charts and facts to describe the current situation on Bitcoin. What we would be looking on would be the support and resistance line, along with the Bitcoin address utilization.
Below we can see the two week number of Addresses with Balance ≥ 10k (aka. Whales):

Note: This demonstrates that there is going to be slight Bitcoin drop and consolidation.
Below we can see the five year number of Addresses with Balance ≥ 10k (aka. Whales):

Note: This chart can help us understand when accumulation and redistribution takes place for Bitcoin.
Below we can see the day chart price of Bitcoin against the number of Addresses with Balance ≥ 10k (aka. Whales):
Note: We can see here how profitable are the whales and now that the price, has dropped dramatically, we are in an accumulation phase. The whales are not making profit, they are accumulating to pump the price.
Note: We can see here how the price of Bitcoin is affected against the RSI and MACD indecators.
Conclusion
IMO we hit rock bottom, I am certain that we can have only consolidation and upward movement now.


No comments:
Post a Comment