Sunday 25 July 2021

Market Outlook - 25/07/2021

 Introduction

In this blog post we are going to talk again about Bitcoin microscopic and macroscopic charts. As the probability for high Bitcoin market volatility increases, we will analyse the current market situation using on-chain metrics and charts. Things started to look better already, but remember the trend is your friend and trade do not date.

I would also like to inform you that we started our new channel, so please feel free to pay us a visit:


Microscopic Outlook

As we can see in the chart below the Bitcoin dominance is increasing and retesting previous resitance line. The most inetersting patterns can be seen by the RSI trend reversal pattern. It looks like smart money are entering the market.


Note: Even though the volume remains low, we can clearly see that Bitcoin is slowly reclaiming dominance.
 
Below we can see the 3m Bitcoin mempool chart:


Note: Volatility is not here there compared to May, but we can see spikes. So Bitcoin constellation is still on the play.
 
On-chain activity remains extremely muted with mempools clearing, and transaction volumes continuing to fall. As the mempool empties, the average block size has fallen by 15% to 20%, down to 1.103M bytes. [1]


Note:  This indicates that demand for Bitcoin block-space and on-chain settlement is low, mined blocks are not full, and the utilization of the network is relatively low.
 
Below we can see the addresses holding more than 10K of BTC (two week chart):
 
Note: This chart information combined with the low volatility shows that the Bitcoin price is going to consolidate, for at least one more week. This chart also shows us that because most of the smart money buys through OTC, and because the addresses holding more than 10k increases and then drops, market manipulators want to slowly increase the Bitcoin price. This is also called the accumulation phase.

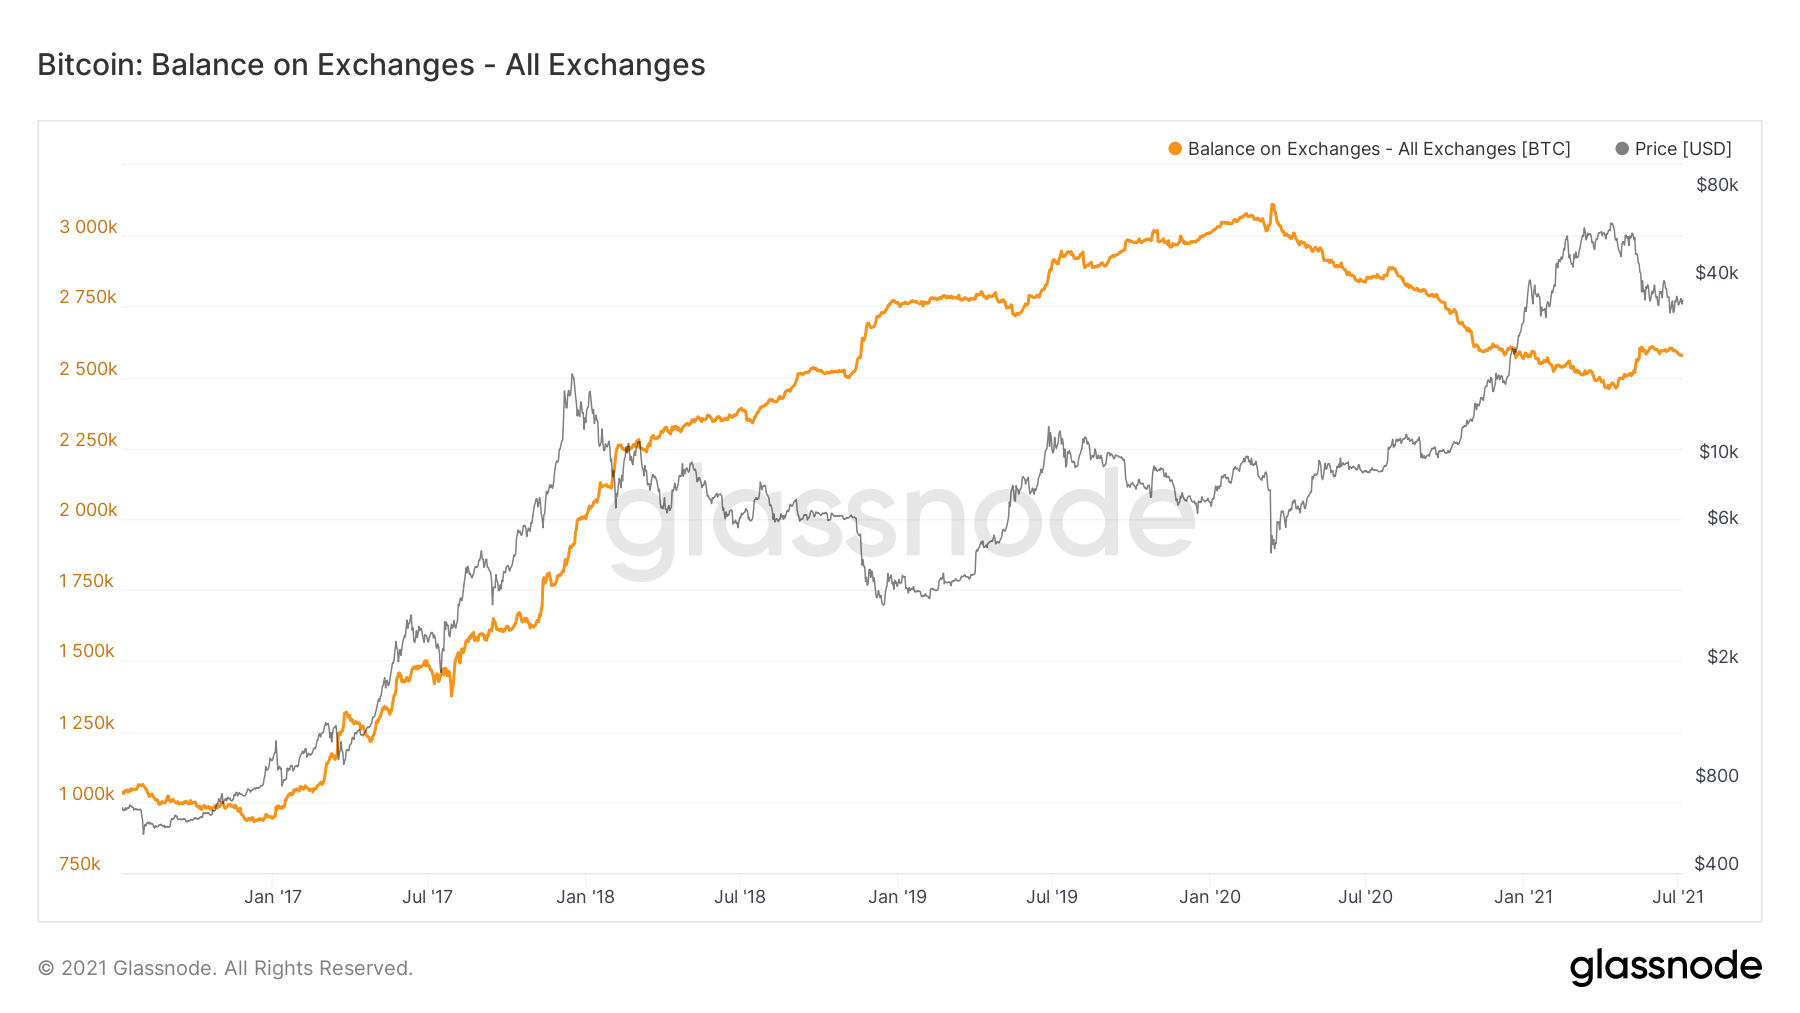
Below we can see the Bitcoin annual exchange reserves:
 

Note: In this chart we can see something very interesting. The Bitcoin exchange reserves is increased.

Below we can see the exchange net flows of BTC (two week chart):


Note: This charts confirms previous conclusion, which are a) BTC hit bottom, b) accumulation started. We can see the pattern designates small increments of the smart money in the BTC cap.

Macroscopic Outlook


We do not have nuch to say about the Bitcoin macros. The most important news about Bitcoin is that high net-worth individuals are buying in:
 
Cathy Woods bought Bitcoin recently (this verifies accumulation started):
 

Rothchilds bought Bitcoin recently (this verifies accumulation started):
 
Bitcoin ETF recently came up (this verifies accumulation started):


Conclusion


The following conclusions are confirmed:
  • Net Entity growth remains positive
  • Exchanges have seen net outflows after an extended period of inflows since mid-May.
  • Smart Money started pouring in
  • It looks like accumulation started.
References:


Thursday 15 July 2021

Market Outlook - 15/07/2021

 Introduction

It has been a really non impressive quiet week in the Bitcoin market as volatility continues to seep out, and prices squeeze into a tight consolidation ranges with low volume. It is starting to feel like the calm before the storm as muted and quiet activity appears across both spot, derivative, and on-chain metrics. This week we will explore a broad range of metrics and indicators across the entire Bitcoin market to establish overall sentiment, volatility triggers, and models for investor behavior.

Below we can see a summary of the BTC on chain  data:
  • BTC Active Address: 819,200, up 0.34%
  • BTC On-Chain TX Vol: 375,200 BTC, down 9.19%
  • On-Chain Transactions: 231,800, up 5.84%
Note: The situation on BTC seems to slightly improve. 

Macro Outlook

It looks like there is an on going hash-rate recovery, that may suggest that offline miners have successfully relocated or re-established their hardware, recovering costs and likely reducing the risk of treasury liquidation sell-pressure. Also slow hash-rate recovery may suggest the converse, where costs and outage continues to take a financial toll, and thus increases the risk of treasury sales [1]. 

This week, the hash-rate has recovered from the peak-trough decline of 55%, to around a 39% decline. Should this level hold and be representative, it would indicate that hash-power equivalent to around ~29% of the affected hash-power has come back online [1].

Below we can see the hash-rate charts (all time chart):


Note: Near the end of the chart we can see the BTC all time slow recovery. 


Below we can see the hash-rate charts (monthly chart):


Note: Near the end of the chart we can see the BTC monthly recovery. 

Below we can see the addresses holding more than 10K of BTC (two week chart):


Note: This chart movement indicates nothing more then consolidation for BTC. 

Below we can see the annual NUPL chart of BTC (annual chart):


Note: This annual NUPL chart shows that BTC is still healthy and looks good.  Net Unrealized Profit/Loss (NUPL) is the difference between Relative Unrealized Profit and Relative Unrealized Loss. This metric can also be calculated by subtracting realized cap from market cap, and dividing the result by the market cap.

Below we can see the annual aSOPR chart of BTC (annual chart):


Note: The Spent Output Profit Ratio (SOPR) is computed by dividing the realized value (in USD) divided by the value at creation (USD) of a spent output. Or simply: price sold / price paid. This metric was created by Renato Shirakashi. The adjusted SOPR is SOPR ignoring all outputs with a lifespan of less than 1 hour. aSOPR is used to identify the local and global tops and bottoms (e.g. weekly and annual tops and bottoms etc.). The chart shows BTC got "reset", and that potentially indicates the Bull trend violently interrupted, in one small Bear trend and potentially a second Bull trend (aka. the Bull run was split on to two Bull trends).

Below we can see the annual aSOPR chart against the BTC price:


Note: In this chart we can see how aSOPR maps tops and bottoms.

Below we can see the addresses holding more than 10K against the BTC price (daily chart):


Note: This chart is showing the addresses holding more than 10K against the BTC price and I am also marking the entry of Elon Musk. We can clearly see the Elon Musk bought at 32-33k, and that is the end point of the accumulation phase and the start of the distribution phase (also known to Wycoff distribution). For more information see this post and this post. I made a mistake in the second post about the entry of Elon Musk. Elon Musk entered at 32-33k as already stated, not 35k.

Micro Outlook

Key theme throughout, the whole, 2020 and Q1 2021 was the relentless depletion of exchange coin reserves, with many of them en route to the Grayscale GBTC Trust, or accumulated by institutions. Now we see the outflow again increasing (an Bullish indicator).

Below we can see the exchange net-flow charts (six month chart):

Note: The inflow movement decreased, with max inflow during May 2021.


Below we can see the exchange net-flow charts (two week chart):


Note: The inflow movement decreased, even more the last two. This potentially indicate a BTC upward movement.

Below we can see the BTC mempool charts (one month chart):


Note: The mempool chart , verifies the low BTC volume for the last month. Again this chart movement  too indicates nothing more then consolidation for BTC. 

Conclusion


Technically speaking I see more consolidation on the BTC price. Nothing much has changed since the last post. It looks like there is going to be some big move.

Below we can see the USDT distribution in top 1% addresses chart against the BTC price (daily chart):


Note: The reason I am showing that is because, it means that someone is deploying USDT for future purchases. It does look reasonable since the Wycoff distribution is finished and we are now in a face of a Wycoff re-accumulation phase. It seems someone is on vacation.  


References: 

Tuesday 6 July 2021

Market Outlook - 06/07/2021

 Introduction 

This blog post is going to focus on facts and charts as usual and will describe the current situation. Are we in a bull market? Are we in a bear market? What is going on? The answer is simple for the long run the entry point for Bitcoin and Ethereum does not real matter. 

It is a fact now, that  the lesser the use cases of an established crypto currency such as Bitcoin the better.  Bitcoin is an asset that has minimal use cases (e.g. Storage of Value , transportation properties etc.) , excellent network effect and it is being adopted by institutions and backed by math and cryptography. Should you be concerned by the drop prices? Not if you are an investor. Now if you trade Bitcoin , then yes, you have to be aware of the current situation and the FUD generated by the media.

The Macro outlook (On Chain Data and Fundamentals)

In this section we will check the macros and for once more see where we are seating. The most important facts to focus on are demand and scarcity. Scarcity can easily be seen from the glassnode charts below.

Below we can see the two week balance on exchanges:


Note: As we can see Bitcoin scarcity is on the rise for the last two weeks.

Below we can see the five year balance on exchanges:

Note: As we can see Bitcoin exchange balances , picked and then started to decline after 15th of March 2020. And since then it is still dropping.

Another interesting chart we can see (from again from on chain data analysis) is the NUPL chart. From the chart below we can see that the NUPL chart was reset for good. This is for me a strong sign of temporary Bull disruption, rather than a pure long Bear market.
 
Below we can see the five year NUPL chart for Bitcoin:


Note:
 As we can see Bitcoin NUPL chart is reset for good, so we are good for now. Net Unrealized Profit/Loss is the difference between Relative Unrealized Profit and Relative Unrealized Loss. This  metric can also be calculated by subtracting realized cap from market cap, and dividing the result by 
the market cap as described in this article.

Below we can see the two week NUPL chart for Bitcoin:


Note: As we can see Bitcoin NUPL chart, again is reset.

Below we can see the five year aSOPR chart for Bitcoin:


Note: As we can see Bitcoin aSOPR chart is again reset for good. Adjusted SOPR (aSOPR) is SOPR ignoring all outputs with a lifespan of less than 1 hour. The Spent Output Profit Ratio (SOPR) is computed by dividing the realized value (in USD) divided by the value at creation (USD) of a spent output. Or simply: price sold / price paid. This metric was created by Renato Shirakashi. SOPR and aSOPR is used to demonstrated local (monthly) and global (annual) bottoms and tops.


Below we can see the two week aSOPR chart for Bitcoin:


Note: As we can see Bitcoin that the two week aSOPR chart shows a reset. This is a good indicator we hit a global bottom.

We covered the scarcity, facts , now lets cover the demand facts. Is there a demand for bitcoin??? Hell yea man. Bitcoin is being accumulated and there is a great demand about it. We can see that from the fundamentals aka. the news released about Bitcoin.

Below we can see certain news about the demand being increased:
  • Adaptation from El Salvador
  • Adaptation from Paraguay (expressed interest)
  • Adaptation from Panama (expressed interest)
Note: For more information see thestreet.com

The Micro outlook (On Chain Data and Charts)

Below we are again going to focus on charts and facts to describe the current situation on Bitcoin. What we would be looking on would be the support and resistance line, along with the Bitcoin address utilization.

Below we can see the two week number of Addresses with Balance ≥ 10k (aka. Whales):


Note: This demonstrates that there is going to be slight Bitcoin drop and consolidation.

Below we can see the five year number of Addresses with Balance ≥ 10k (aka. Whales): 


Note: This chart can help us understand when accumulation and redistribution takes place for Bitcoin.


Below we can see the day chart price of Bitcoin  against the number of Addresses with Balance ≥ 10k (aka. Whales): 


Note: We can see here how profitable are the whales and now that the price, has dropped dramatically, we are in an accumulation phase. The whales are not making profit, they are accumulating to pump the price.

Below we can see the day chart price of Bitcoin  against the number of Addresses with Balance ≥ 10k (aka. Whales) with RSI and MACD indicators: 


Note: We can see here how the price of Bitcoin is affected against the RSI and MACD indecators.


Conclusion

IMO we hit rock bottom, I am certain that we can have only consolidation and upward movement now.


Market outlook 04-11-2021

 Bitcoin Status The Bitcoin volume is not here yet, it seems that the retails is not "lured" yet in to the planned big "pump ...