Wednesday 21 April 2021

Market Outlook - 21/04/2021

 Introduction 

In this blog post we are going to analysis ETH short term (grab the money and run), and what trades to open on ETH [1]. ETH reached all time high (ATH) at 2500 something, this price could be predicted with fb entrancement.
 
See below:


Note: This chart shows the Fibonacci retrenchment hitting the psychological resistance close to  2500 dollars. ETH also has a significant de-coupling after January 2021 (about 9%), due to the fees and some other issues. It seems that ETH is going to retest very soon the 2500 dollar resistance pretty soon.

ETH TA

Below we can see that ETH formed a reverse double bottom:


Note: Set your limit sell order to 2300 something, as 2500 is a psychological resistance. A 10x on 2370 is safe enough. ETH seems to create a pennant after the 2279 dollar resistance. Also the latest 4hr resistance can act as a support.

ETH every time it is testing the EMA ribbon bonces back up: 


Note: ETH today is moving above the EMA ribbon and has successfully completed a ribbon bonce. 

UPDATE (22/04/2021)

We can see now that on the 1hr chart ETH created a channel:


And on 1day chart the ETH FBR is targeting the 4159dollars: 


References:

Wednesday 14 April 2021

Market Outlook - 14/04/2021

 Introduction 

This article is going to focus on a few coins and run a basic analysis for opening trades. Below I am listing some interesting coins that look promising for short term trading.

Bitcoin

Below we can see the 4hr Tradingview chart:


Note:  BTC seems is going to consolidate the next couple of weeks.

Below we can see the day Tradingview chart:


Note: We can see that BTC volume drops, MACD and RSI show a minor trend cool down. My speculation is that BTC will go side ways for the next couple of weeks, unless something big happens.

Below we can see the Glassnode BTC Exchange 2 week NETflow:


Note: The inflow seem to to increase, which conform a BTC consolidation. 

Below we can see the Glassnode BTC Exchange 2 week reserve:


Note: It looks like the downtrend will continue, which is good as a macroscopic indecator.

Zilliqua (ZIL)

Below we can see the 4hr Tradingview chart:


Note: Volume reduced , RSI and MACD shows a reversal.


Below we can see the day Tradingview chart:


Note: Volume reduced , RSI and MACD shows a reversal. Strong support at 0.14677 dollars.

Uniswap (UNI)

Below we can see the 4hr Tradingview chart:


Note: It looks like Uniswap is preparing to make a significant move in the next days. Uniswap is forming a pennant! and volume pattern supports that.

Below we can see clearly the pattern:


Note:   In technical analysis, a pennant is a type of continuation pattern formed when there is a large movement in a token, known as the flagpole, followed by a consolidation period with converging trend lines—the pennant—followed by a breakout movement in the same direction as the initial large movement, which represents the second half of the flagpole.

Below we can see the day Tradingview chart:


Note: This chart confirms the imminent upwards move. This is a even now a good entry point. 

Below we can see the Glassnode Uniswap Exchange 2 week NETflow:

Note: It seems that Uniswap exchanges outflow are about to increase.

Below we can see the Glassnode Uniswap Exchange 2 week reserve:

Note: It seems that Uniswap exchanges balance is dropping  and this info combined with the Unipig (Uniswap v3 upgrade) update is going to give a boost to the coin. This chart confirms the upwards move for UNI too!!

Binance Coin (BNB)

Below we can see the day Tradingview chart:


Note: This chart demonstrates that BNB is now in a price discovery move after hitting ATH. Just bare in mind that BNB has a 90% plus correlation with BTC, even though it is a utility coin and a fork of ETH  Binance proved that can and will deliver (compared to ETH). Also this combined with the staking options provided and the burning features makes is a good candidate for hitting 1000 dollars by end of year if not more!!! Bare in mind that BNB Market Cap hit $88,350,515,767 and 100b is a psychological level..... 

Below we can see the Glassnode BNB Exchange 2 week NETflow:


Note: The exchange netflow shows that it might be an inflow on the immediate future , if this continues will affect negatively the price. 


Below we can see the Glassnode BNB Exchange 1 month reserve:


Note: This chart shows that the BNB reserves for the last month increased and this might actually have an negative impact on the price, that might cause BNB to consolidate.


LoopringCoin (LRC)

Below we can see the day Tradingview chart:


Note: LRC looks good baby. LRC is using zkRollup and is an Exchange and Payment Protocol. Loopring protocol can settle up to 2,025 trades per second while guaranteeing the same level of security as the underlying Ethereum blockchain. This is made possible by using a construction called zkRollup, which aggregates and executes transactions off-chain, in a provably correct manner. This is also a layer 2 solution that competes with ETH FYI. The longer the ETH waits for the upgrades, the longer LRC is going to boost. Both oscillators show an uptrend. 

Below we can see the Glassnode Loopring Exchange 2w Netflow:


Note: Whales seem to withdraw from Loopring and this is good for the price.

Below we can see the Glassnode Loopring Exchange 1 month reserve:


Note: Reserve goes up and might not be good.

Matic Network or Polygon (MATIC)

Below we can see the day Tradingview chart:


Note: Matic, another layer 2 solution solving the congestion problem with ETH seems to do good, although my view point is that it is going to consolidate for while , untill see some big move.

Below we can see the Glassnode Loopring Exchange 1m Netflow:


Note: This chart shows as the MATIC is either going to wither consolidate for while or even drop its price. 

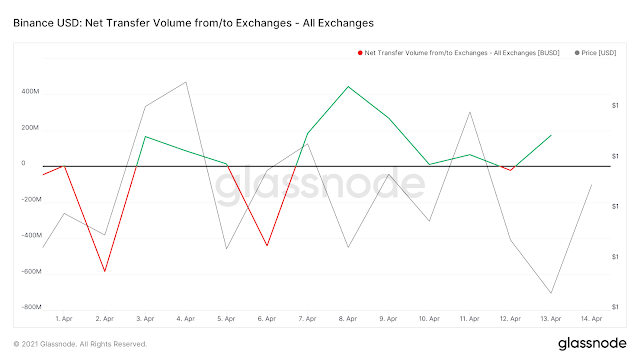
Below we can see the Glassnode MATIC Exchange 1 month reserve:


Note: The monthly MATIC reserve drops and this is good as a microeconomics indicator.  Although in the short term I would not wait for a significant move. It seems that MATIC is in an accumulation phase right now.

Below we can see the Glassnode MATIC staking 1 month chart:


Note: Microscopically speaking the chart above shows that whales and retail are moving their MATIC out of staking and into the exchanges, which designates some serious price action move. Meaning that people either move to other altcoins or actively trade MATIC. This smells accumulation!!!


Friday 9 April 2021

ParaState Performance on steroids

 Introduction 

Today we are going to talk about a technology I am got excited about the ParaState tech. ParaState aims to become a Polkadot parachain that extends the frontier of Ethereum with a substrate framework. By supporting 20+ programming languages to create Ethereum-compatible smart contracts [1].


But before we dive deeper into the technology feel free to review the ParaState links below:


ParaState goal is to provide an industry standard, highly optimized, and extensible smart contract execution environment, while maintaining Ethereum compatibility. It does so as a Polkadot parachain, which allows it to provide services to other Polkadot parachains and applications, and at the same time, to take advantage of cross-chain services provided by other parachains. 
  • ParaState will be compatible with Ethereum
  • ParaState comes with core DeFi infrastructure
  • ParaState is fully compatible with Uniswap
Also ParaState will create a stand-alone substrate blockchain that interacts with Polkadot through parathreads initially. This allows ParaState to launch a Layer 1 blockchain securely and economically. More specifically parathreads are an idea for parachains to temporarily participate (on a block by block basis) in Polkadot security without needing to lease a dedicated parachain slot [2].

Social Media Presence 


ParaState has a relatively strong social community presence even through it is still in a starting point. Below we can see the stats:
  • Twitter: 3205 Followers
  • Telegram: 3385 members, with 765 online
  • Discord: 135 Plus members online  
In the social media the atmosphere is light, but questions and announcements about the technology are announced. 

Repository Overview 


The repository of ParaState looks pretty code, with often contributions and multiple developers:


 Conclusion


The project is in early stage, but looks promising, not much information is released yet. 


References: 

Sunday 4 April 2021

The Exit Strategy

 Introduction 

This article is going to focus on our exit strategy, this means I am going to explain when should we run away with our profits and buy the lambo. If this is the info your are looking this article is the right one for you. When talking about exit strategy these are the charts you should be looking for:
  1. BTC Chart - BTC is the king, what ever BTC does Altcoins follow
  2. BTC Dominance chart - This chart shows the money flow and is a serious indicator
  3. Altcoin Market Cap - This chart shows the money flow for Altcoins


In this article we are going to analyse how the three mentioned charts behaved during previous market cycle. 

What is Bitcoin Dominance?


Below we can see the BTC dominance chart from 2015 to 2020:


Note: Bitcoin dominance is a percentage of the total cryptocurrency market capitalisation attributable to Bitcoin. According to CoinMarketCap, BTC now dominates 55.2% of the market. The BTC price is $58,139.11. Total market capitalization is  $1,966,834,918,015. 

During long-term market shifts, the dominance metric can show whether demand for Bitcoin remains higher than the market average. When market value increases, BTC dominance declines. As Bitcoin grows rapidly, the rest of the market is capable of pumping either at the time of local BTC corrections or when the benchmark is at least slowed down at significant resistance levels [1]. 

Price measures Bitcoin’s popularity. Dominance measures its popularity compared to other cryptocurrencies. Theoretically, this may mean investors are choosing quality. They are scared of the market risk and switch from tokens with less capital to a safer asset. It may also mean growing interest in the sector as a whole, along with the belief that Bitcoin is just the most reliable investment [1].

Below we can see a schematic visualisation on the relationship between BTC and Altcoins:


Note: If we divide the total market capital of Bitcoin by the total market capital of all cryptocurrencies and multiply the value by 100, we get Bitcoin Dominance. We can also find the dominance of any coin by doing the same step [2].

Bitcoin Dominance Versus Altcoin Price

When Bitcoin price goes up, the Altcoin prices go down and vice versa. Below we can see a schematic representation on the BTC and Altcoin relationship.


When BTC dominance increases, it means that investors in crypto are looking for a less volatile and safer investment. It is analogous to buying A-list stocks or YEN in forex or gold in commodities. During market uncertainty, investors shift towards less volatile and highly liquid assets like BTC rather than investing in altcoins with low liquidity and market cap. 

History of Bitcoin Dominance


Since the introduction of an additional 10 cryptocurrencies, BTC dominance has been mostly above 50% in terms of market dominance. Until November 2014, BTC dominance was above 90%. After the introduction of XRP, the dominance started falling and reached 78% when XRP dominance was at 13% during the first altcoins season. The dominance of BTC crawled back towards 90% in the beginning of 2016 until ETH got listed across exchanges, which took 13% of the market cap and led the dominance of BTC to drop down to the 70s before it again started crawling back up.

Note: The major drop in BTC dominance was in mid-2017 when Ether became extremely popular and it started looking like it can dethrone BTC. BTC dominance fell to 38% while ETH dominance peaked at 31% in June 2017.

Here is a tabular summary of the relationship between BTC’s dominance, BTC’s price, and altcoins’ price.


Note: When the tabular summary uses the word Stable, it means that the BTC chart price is consolidating or moves side ways.  Now when the BTC dominance increases (meaning investors and traders move to BTC market cap) and the BTC price decreases, means that BTC is being de-evaluated and at the same time market cap is being increased, and this might be a strong indicator of Bull run end.

Crypto Bull Run End

Bitcoin price is losing bullish momentum. Although it has still managed to hold above support at $55,000, after a failed attempt to clear the $60,000 resistance, the trend has been down over the last week. Jiang Zhuoer is the CEO of BTC.Top mining pool, he claimed things might continue to go south during the year. In a recent interview with Wu Blockchain citing “study models”, Zhuoer predicted a change in crypto market dynamics. Bitcoin’s price has seen gains of 824.4% in one year, but Zhuoer believes that between September 2021 and June 2021, the market could move “from a bull to a bear market.” [3]

Below we can see the BTC dominance chart with RSI and MACD oscillators:


Indicator of Bull Run 1:   Above we can see that due to the increase of the Altcoin market cap (there are over 10.000 Altcoins now days), over the time BTC dominance is reduced dramatically. When the price of the BTC starts reducing and the dominance starts increasing, then it is time to hit the road.

Below we can see the Glassnode NUPL chart:


Indicator of Bull Run 2:  Net Unrealized Profit/Loss is the difference between Relative Unrealized Profit and Relative Unrealized Loss. When BTC hits Euphoria, it is time to hit the road.

Below we can see the Glassnode aSOPR chart:


Note: The chart above is using spent outputs to predict bitcoin local lows and tops. The Spent Output Profit Ratio (SOPR) is computed by dividing the realised value (in USD) divided by the value at creation (USD) of a spent output. Or simply: price sold / price paid. This metric was created by Renato Shirakashi. The adjusted SOPR (aSOPR) is SOPR ignoring all outputs with a lifespan of less than 1 hour. 

Below we can see the Glassnode aSOPR chart on 2017 peak:


Indicator of Bull Run 3: Above we can see that there is some lagging above between the aSOPR peak and the big price drop of 10 days.

Below we can see the Glassnode aSOPR chart on 2017 peak zoom in:


Note: Above we can see the indicator hit above 1.08, which is local top top. 

Final Words

It is important to understand that the events will take place in the following order:
  1. BTC dominance increases
  2. BTC price consolidates
  3. Altcoin prices increase
  4. BTC price starts droping
  5. Altcoin prices keep increasing
  6. BTC price starts droping
  7. Altcoin price starts droping
Also for the indicators you should be looking:
  1. NUPL to hit blue
  2. aSOPR to hit above 1.25 to 1.3 or for the risky ones above 1.4
  3. Clear reversal of the BTC dominance and price drop for at least 2 weeks.


References:


Friday 2 April 2021

Market Outlook 02/04/2020

 Introduction 

This article is going to focus only on ETH TA and on-chain data to explain when and how much ETH is going to move upwards. The live Ethereum price today is $2,078.86 USD with a 24-hour trading volume of $33,681,608,200 USD. Ethereum is up 7.48% in the last 24 hours.  

Ethereum is breaking out of a accenting triangle, a consolidation pattern that appears usually during an uptrend. That slightly increases the cryptocurrency’s potential to log an extended bullish move, with upside targets as high as the length of the previous uptrend. That puts ETH/USD en route to $3,000 in a short-term scenario. ETH is relatively confusing currency to trade since it seems to not react to good news fast, if not at all.

Below we can see the 4hr chart for ETH from tradingview:


Note: The MAs seem to work as strong support lines.

The main question remains whether Ethereum could continue trading upward as its trades near $2,000, which is also notorious for triggering sell-offs. According to my and others humble opinion  ETH needs first to confirm a daily and weekly close above $2,000 to flip the level into support. Should the pair manage that, it would face no resistance in extending its rally to as high as $2,500. After that ETH goes to price discovery mode. ETH has been severely suppressed so far, due to the miner conflict and other projects working on layer 2 solutions. For more info see Ethereum Coming Upgrades And Price.   

Below we can see the daily chart for ETH from tradingview:


Note: The daily RSI and MACD show a strong uptrend for ETH. 

Below we can see the 4hr chart for ETH from tradingview:


Note: The 4hr RSI and MACD also show a strong uptrend for ETH. Might be a good idea for Margin trading gals and dudes.

ETH Fundamentals 

The latest rally in Ethereum markets closely followed Visa’s decision to conduct a stablecoin transaction on its legacy payment platform. The dollar-pegged token in concern was USDC, which functions atop the Ethereum blockchain. Meanwhile, on April 1, billionaire investor Mark Cuban admitted that he owns many Ethereum tokens, praising its smart contracts features that would back the now-booming decentralised finance and non-fungible tokens sector. Also we are reaching critical reserve points on ETH, in the exchanges.

Below we can see from Glassnode the 3m total ETH reserves: 


Below we can see from Glassnode the 3m ETH reserves per exchange: 


Market outlook 04-11-2021

 Bitcoin Status The Bitcoin volume is not here yet, it seems that the retails is not "lured" yet in to the planned big "pump ...