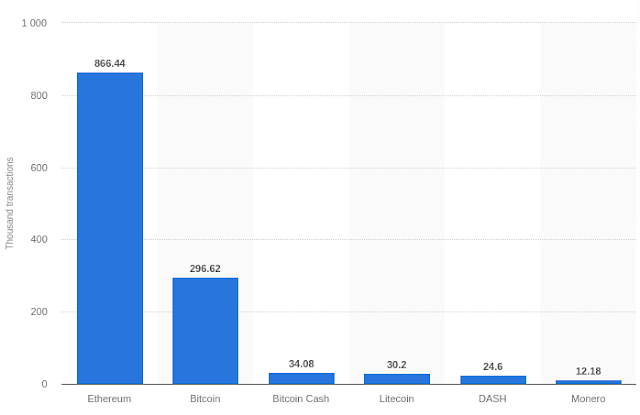
Introduction
The importance of the blockchain portfolio diversification due to high volatility is important. Analysing cryptocurrencies can only br done properly using heavy statistical models so as to be as much as possible in the safe side. In order to achieve that I will demonstrate how BTC, ETH, XRP and COMP correlate using three different methods (Pearson, Kendall and Spearman) in three different time periods. A long term time period (e.g. since 2015), a medium length period (one year) and short term period (14 days). But first lets talk about the methods that are going to be used.
Pearson Correlation Coefficient
In statistics, the Pearson correlation coefficient (PCC), also referred to as Pearson's r, the Pearson product-moment correlation coefficient (PPMCC), or the bivariate correlation, is a statistic that measures linear correlation between two variables X and Y. It has a value between +1 and −1. A value of +1 is total positive linear correlation, 0 is no linear correlation, and −1 is total negative linear correlation.
A value of 1 implies that a linear equation describes the relationship between X and Y perfectly, with all data points lying on a line for which Y increases as X increases. A value of −1 implies that all data points lie on a line for which Y decreases as X increases. A value of 0 implies that there is no linear correlation between the variables.[1]
Kendall rank correlation coefficient
In statistics, the Kendall rank correlation coefficient, commonly referred to as Kendall's τ coefficient, is a statistic used to measure the ordinal association between two measured quantities. A τ test is a non-parametric hypothesis test for statistical dependence based on the τ coefficient. [2] The numbers which give us the exact position of an object are called ordinal numbers.
Ordinal numbers tell the position of an object rather than their quantity. Intuitively, the Kendall correlation between two variables will be high when observations have a similar (or identical for a correlation of 1) rank (i.e. relative position label of the observations within the variable: 1st, 2nd, 3rd, etc.) between the two variables, and low when observations have a dissimilar (or fully different for a correlation of −1) rank between the two variables.
The Kendall rank coefficient is often used as a test statistic in a statistical hypothesis test to establish whether two variables may be regarded as statistically dependent. This test is non-parametric, as it does not rely on any assumptions on the distributions of X or Y or the distribution of (X,Y).
Spearman's Rank Correlation Coefficient
In statistics, Spearman's rank correlation coefficient, is a nonparametric measure of rank correlation (statistical dependence between the rankings of two variables). It assesses how well the relationship between two variables can be described using a monotonic function.
The Spearman correlation between two variables is equal to the Pearson correlation between the rank values of those two variables; while Pearson's correlation assesses linear relationships, Spearman's correlation assesses monotonic relationships (whether linear or not). If there are no repeated data values, a perfect Spearman correlation of +1 or −1 occurs when each of the variables is a perfect monotone function of the other.[3]
A monotonic relationship is a relationship that does one of the following:
- As the value of one variable increases, so does the value of the other variable; or
- As the value of one variable increases, the other variable value decreases.
Intuitively, the Spearman correlation between two variables will be high when observations have a similar (or identical for a correlation of 1) rank (i.e. relative position label of the observations within the variable: 1st, 2nd, 3rd, etc.) between the two variables, and low when observations have a dissimilar (or fully opposed for a correlation of −1) rank between the two variables.[3]
The Analysis
As already stated we are going to analyse BTC, ETH, XRP and COMP. After that I am going to talk about the coin properties and attempt to identify the associations, between each coin. At this point it is wise to state that the different coin properties add different psychological preferences for both institutional and retail investors e.g. the investors assume based on the currency properties etc.
So here we go
As we can see from the tables above, using different approaches to statistically analyse coin relationship gives us different results. The one that is the most obvious is the XRP with the BTC. Even though ETH and XRP correlate 90%+ , XRP and BTC do not correlate very in the Spearman analysis, but do well with Kendall and Pearson.
- RippleNet is a network of institutional payment-providers such as banks and money services businesses that use solutions developed by Ripple to provide a frictionless experience to send money globally.
- Unlike Bitcoin or Ethereum, Ripple doesn’t have a blockchain aka is centralised. Ripple has is own patented technology: the Ripple protocol consensus algorithm (RPCA).
- ETH is using a blockchain.
- Mining through proof of work (soon to change)
- Ethereum is a decentralized system
- Was build to support contracts
- BTC is using a blockchain.
- Mining through proof of work
- BTC is a decentralized system
- BTC is a money-transfer system
- Runs on top of ETH platform
- Compound Protocol is a suite of Ethereum smart contracts
- In order to supply or borrow assets from the protocol, you need to write to the Ethereum blockchain.
References
- https://en.wikipedia.org/wiki/Pearson_correlation_coefficient [1]
- https://en.wikipedia.org/wiki/Kendall_rank_correlation_coefficient [2]
- https://en.wikipedia.org/wiki/Spearman%27s_rank_correlation_coefficient [3]
- https://www.statista.com/statistics/730838/number-of-daily-cryptocurrency-transactions-by-type/#:~:text=Number%20of%20daily%20cryptocurrency%20transactions%202020%2C%20by%20type&text=In%20the%20second%20quarter%20of,daily%20transactions%20in%20that%20quarter. [4]
- https://cointelegraph.com/ethereum-for-beginners/what-is-ethereum [5]
- https://nakamoto.com/what-are-the-key-properties-of-bitcoin/ [6]


No comments:
Post a Comment